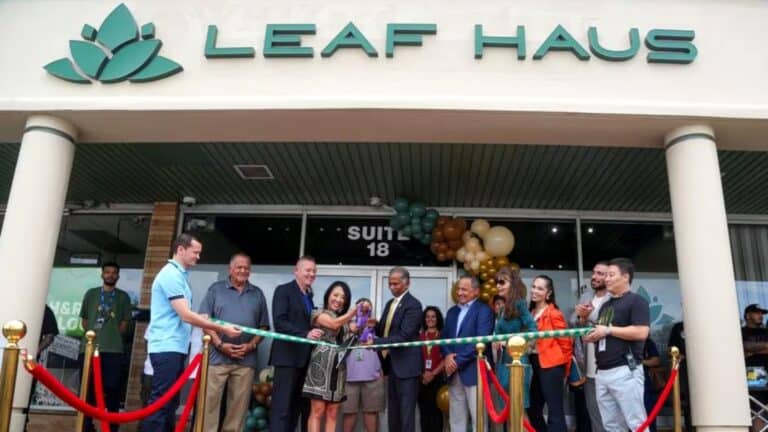
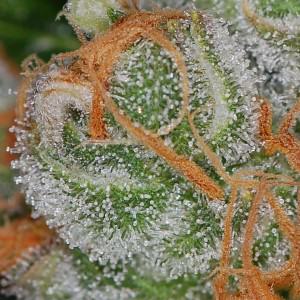
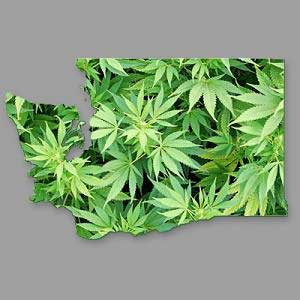
 The State of Washington voted to legalize recreational marijuana during the 2012 Election. It took until July of 2014 for the first legal recreational marijuana transaction to occur at a licensed recreational marijuana store in Washington. Since then Washington’s cannabis industry has experienced some hiccups, but for the most part recreational marijuana sales numbers have climbed since sales began. But which county purchases the most marijuana per capita? Below is a list, broken down by county, of how much each Washington county spends on recreational marijuana per capita. The list is via The Joint Blog:
• Asotin, $78,390 in total sales, $3.60 in per capita sales
• Benton, $2,840,375, $15.87
• Chelan, $1,387,908, $19.00
• Clallam, $1,400,405, $19.52
• Clark, $24,625,881, $56.93
• Cowlitz, $4,562,059, $44.68
• Douglas, $1,668,086, $42.98
• Grant, $1,325,700, $14.70
• Grays Harbor, $978,614, $13.57
• Island, $1,185,035, $15.04
• Jefferson, $1,530,906, $51.23
• King, $48,165,054, $24.39
• Kitsap, $4,907,633, $19.42
• Kittitas, $1,374,389, $33.29
• Klickitat, $1,351,236, $65.80
• Lewis, $208,480, $2.76
• Mason, $365,731, $6.03
• Okanogan, $617,733, $15.01
• Pacific, $348,064, $16.75
• Pierce, $16,425,732, $20.39
• San Juan, $251,106, $15.91
• Skagit, $4,403,722, $37.43
• Skamania, $351,594, $31.60
• Snohomish, $17,451,819, $24.08
• Spokane, $22,337,229, $47.14
• Stevens, $650,613, $14.95
• Thurston, $5,889,800, $23.00
• Whatcom, $8,005,488, $39.39
• Whitman, $2,017,669, $44.33
• Yakima, $2,808,902, $11.48
As you can see, Klickitat county spends considerably more money per capita on recreational marijuana compared to other Washington counties. As you can see, Lewis county spent the least. So if you are looking at moving in the Washington State area, and you are wondering where the most recreational marijuana is purchased (so that you are around like minded people), these stats could potentially help you!

